> ## Documentation Index
> Fetch the complete documentation index at: https://knowledge.flowella.io/llms.txt
> Use this file to discover all available pages before exploring further.
# Channel analytics, template performance, and usage
> Track conversations, outbound messages, opt-outs, template performance, and usage trends per channel, with date-range presets, drill-down, and CSV export.
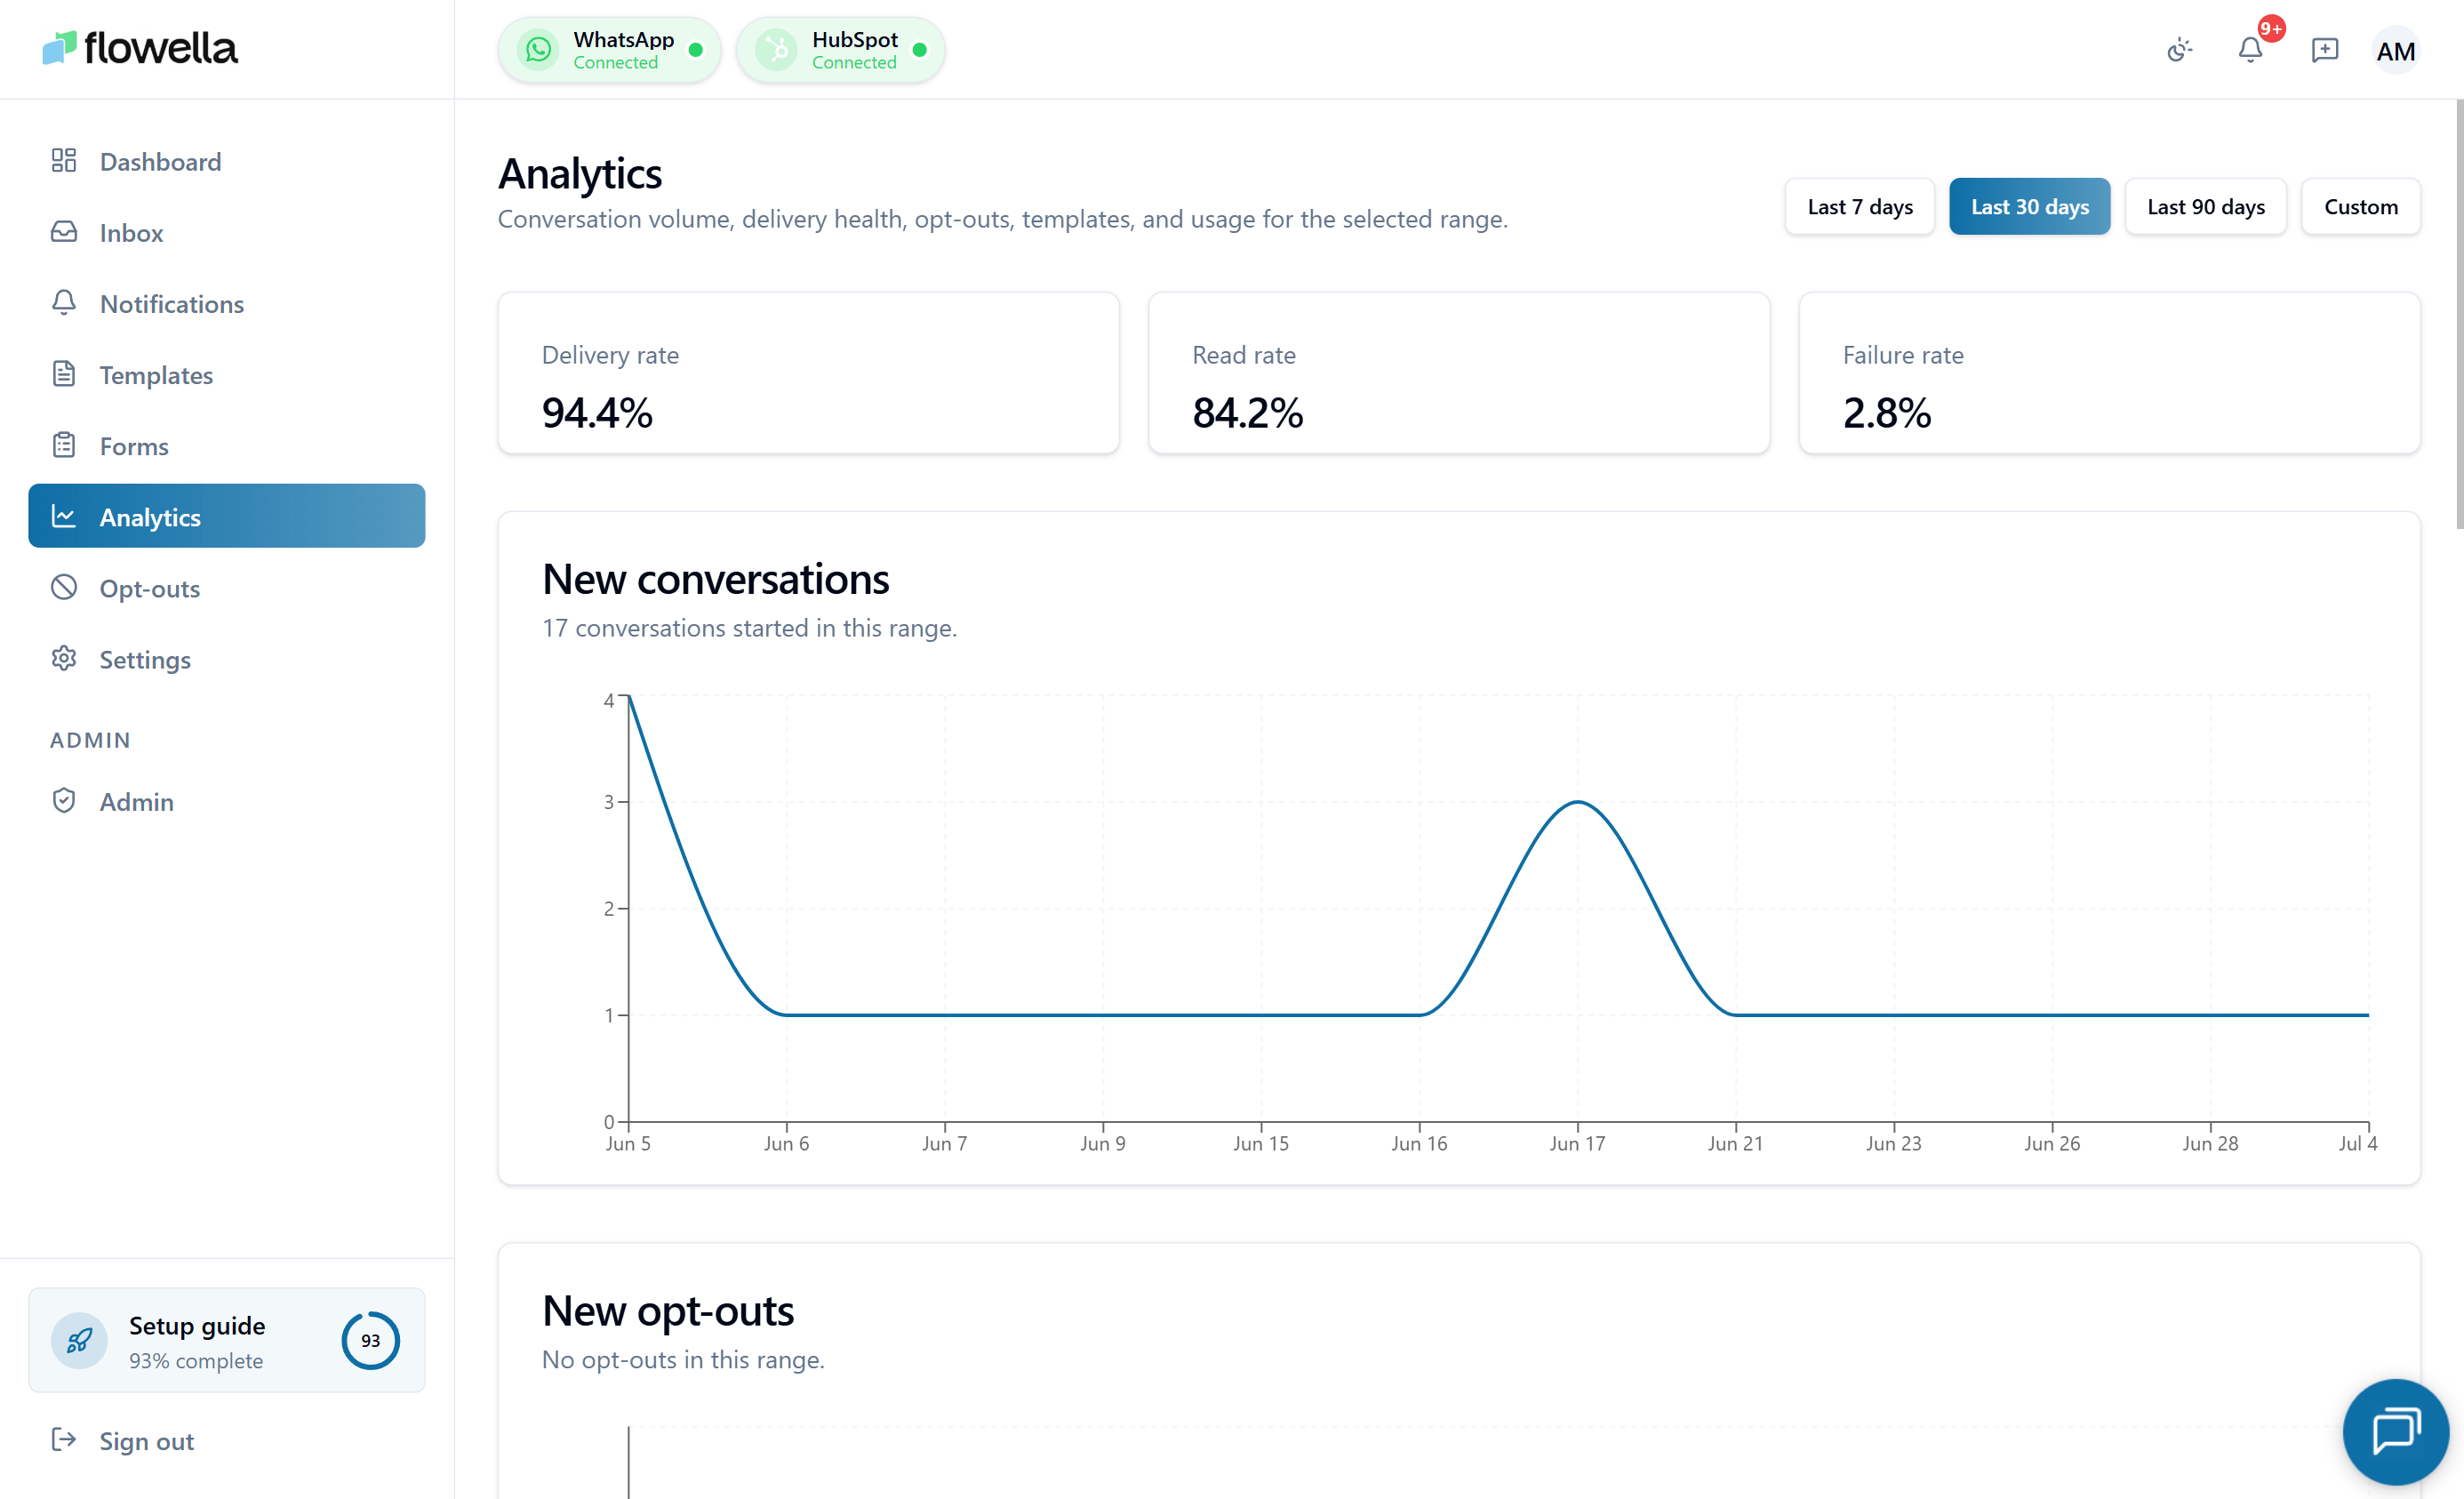 Analytics gives you per-channel reporting on conversations, outbound messaging, opt-outs, template performance, and usage. Use it to monitor delivery quality, spot trends, and pull data into spreadsheets when you need to share results.
## How to open it
Analytics is a channel-scoped page. Pick the channel you want, then go to:
```text theme={null}
/{org}/{waba}/{phone}/analytics
```
Or open **Analytics** from the left navigation while you have a channel selected.
For how channel scoping works, see [Multi-channel](/essentials/multi-channel).
## Date range
The page includes three presets and a custom range:
* **Last 7 days**
* **Last 30 days** (default)
* **Last 90 days**
* **Custom** — pick any start and end date
Granularity is chosen automatically based on the range:
| Range | Granularity |
| -------------- | ----------- |
| Up to 45 days | Day |
| 46 to 120 days | Week |
| Over 120 days | Month |
## Metrics
### Channel summary
Three headline numbers for the selected range and channel:
* **Delivery rate** — percentage of outbound messages Meta confirmed delivered.
* **Read rate** — percentage of delivered messages the recipient opened.
* **Failure rate** — percentage of outbound messages that failed. The number renders in **red only when failure rate is above 5%** and there has been outbound activity in the range. With no activity, the page shows a neutral "No activity in this range" message rather than a misleading red 0.0%.
### Conversations over time
A line chart of distinct conversations per day, week, or month. A "conversation" is any thread with at least one inbound or outbound message in that bucket.
### Opt-outs over time
New opt-outs per bucket. Useful for spotting spikes that might correlate with a specific campaign or template.
### Usage over time
Total outbound messages per bucket, used for capacity planning against your [plan limits](/account/plans-and-limits).
### Templates table
A per-template breakdown for the selected range:
* **Send count**
* **Delivery rate**
* **Read rate**
Sort the table to find your best- and worst-performing templates.
### Per-template drill-down
Click any row in the **Templates table** to open a side sheet with **100% of the send logs** for that template in the current date range (not a sampled subset).
The side sheet shows:
* **One row per send**, with recipient phone (masked), send time, **status** (Queued, Sent, Delivered, Read, Failed, Suppressed), and the same plain-English **Details** column as the template's own Statistics tab — see [Templates → Per-send Details column](/app/templates#per-send-details-column).
* **Search** by phone or message content.
* **Sort** by any column (defaults to send time, newest first).
* **Status filter chips** at the top to narrow to a single outcome — for example, only **Failed** to triage delivery issues.
#### Per-template export
The drill-down side sheet has its own **Export** dropdown that produces a **CSV** or **PDF** for just this template — independent of the main page-level export described below. Use it when you need to share or audit performance for one template without pulling the whole channel's data.
## Exporting data
Click the **Export** dropdown to download the data behind the charts and table. You can pick:
* **CSV** — one file containing the five metrics (conversations, messages, opt-outs, templates, usage).
* **PDF** — a snapshot of the current charts for sharing.
Exports are produced in the background. Flowella shows "Export queued" while preparing it and "Export ready" with a download link when done. You can leave the page and come back — the link is also delivered as a notification.
## Sample data
If you have no WhatsApp channel connected yet, Analytics still renders with **illustrative numbers** behind a "Sample data" callout. This lets you preview the page without committing to set-up.
Pair the templates table with [the templates page](/app/templates) to identify low-read-rate templates that may need rewording or category changes.
## Related
The 7-day snapshot that feeds the org home page.
Surface WhatsApp activity alongside email, calls, and meetings.
What Meta watches and how delivery / read rates feed into it.
Meta's per-day send caps that interact with these metrics.
Analytics gives you per-channel reporting on conversations, outbound messaging, opt-outs, template performance, and usage. Use it to monitor delivery quality, spot trends, and pull data into spreadsheets when you need to share results.
## How to open it
Analytics is a channel-scoped page. Pick the channel you want, then go to:
```text theme={null}
/{org}/{waba}/{phone}/analytics
```
Or open **Analytics** from the left navigation while you have a channel selected.
For how channel scoping works, see [Multi-channel](/essentials/multi-channel).
## Date range
The page includes three presets and a custom range:
* **Last 7 days**
* **Last 30 days** (default)
* **Last 90 days**
* **Custom** — pick any start and end date
Granularity is chosen automatically based on the range:
| Range | Granularity |
| -------------- | ----------- |
| Up to 45 days | Day |
| 46 to 120 days | Week |
| Over 120 days | Month |
## Metrics
### Channel summary
Three headline numbers for the selected range and channel:
* **Delivery rate** — percentage of outbound messages Meta confirmed delivered.
* **Read rate** — percentage of delivered messages the recipient opened.
* **Failure rate** — percentage of outbound messages that failed. The number renders in **red only when failure rate is above 5%** and there has been outbound activity in the range. With no activity, the page shows a neutral "No activity in this range" message rather than a misleading red 0.0%.
### Conversations over time
A line chart of distinct conversations per day, week, or month. A "conversation" is any thread with at least one inbound or outbound message in that bucket.
### Opt-outs over time
New opt-outs per bucket. Useful for spotting spikes that might correlate with a specific campaign or template.
### Usage over time
Total outbound messages per bucket, used for capacity planning against your [plan limits](/account/plans-and-limits).
### Templates table
A per-template breakdown for the selected range:
* **Send count**
* **Delivery rate**
* **Read rate**
Sort the table to find your best- and worst-performing templates.
### Per-template drill-down
Click any row in the **Templates table** to open a side sheet with **100% of the send logs** for that template in the current date range (not a sampled subset).
The side sheet shows:
* **One row per send**, with recipient phone (masked), send time, **status** (Queued, Sent, Delivered, Read, Failed, Suppressed), and the same plain-English **Details** column as the template's own Statistics tab — see [Templates → Per-send Details column](/app/templates#per-send-details-column).
* **Search** by phone or message content.
* **Sort** by any column (defaults to send time, newest first).
* **Status filter chips** at the top to narrow to a single outcome — for example, only **Failed** to triage delivery issues.
#### Per-template export
The drill-down side sheet has its own **Export** dropdown that produces a **CSV** or **PDF** for just this template — independent of the main page-level export described below. Use it when you need to share or audit performance for one template without pulling the whole channel's data.
## Exporting data
Click the **Export** dropdown to download the data behind the charts and table. You can pick:
* **CSV** — one file containing the five metrics (conversations, messages, opt-outs, templates, usage).
* **PDF** — a snapshot of the current charts for sharing.
Exports are produced in the background. Flowella shows "Export queued" while preparing it and "Export ready" with a download link when done. You can leave the page and come back — the link is also delivered as a notification.
## Sample data
If you have no WhatsApp channel connected yet, Analytics still renders with **illustrative numbers** behind a "Sample data" callout. This lets you preview the page without committing to set-up.
Pair the templates table with [the templates page](/app/templates) to identify low-read-rate templates that may need rewording or category changes.
## Related
The 7-day snapshot that feeds the org home page.
Surface WhatsApp activity alongside email, calls, and meetings.
What Meta watches and how delivery / read rates feed into it.
Meta's per-day send caps that interact with these metrics.